Download PDF
Q4 2024 Review
With the transition from the Biden administration to President Trump’s leadership, 2025 has already seen significant economic and geopolitical realignments. The U.S. dollar has gained strength as markets react to the administration’s protectionist stance, including proposed tariffs of 25% on Canadian and Mexican imports and 10% on Chinese goods. While much remains uncertain as these policies undergo scrutiny, one thing is evident: Trump’s presidency is already reshaping global expectations.
Interest Rate Divergence
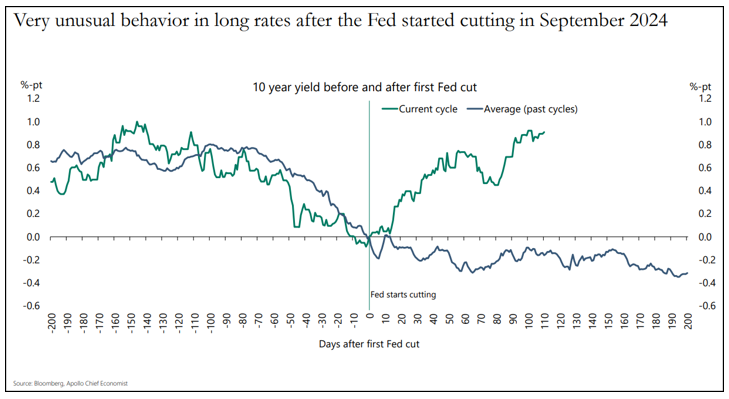
Source: Bloomberg, Apollo
It has been 135 days since the Federal Reserve began cutting rates. As shown above, during past cutting cycles the 10-Year Treasury yield typically falls before and after the Fed begins cutting the Federal Funds Rate. Since September 17th, however, we have seen the 10-Year yield jump from 3.60% (9/17/2024) to 4.80% (1/14/2025) and settle in the 4.50% range this week (1/31/2025). There are many potential reasons why longer rates have risen during the present cutting cycle. We do not agree with all of the reasons but do believe the rise in rates is due to a mix of some of the reasons below:
1 - Economic Resilience
If the economy is showing signs of resilience or recovery, investors might anticipate stronger future growth. This could lead to expectations of higher inflation or real returns in the future, causing upward pressure on long-term yields.
2 - Market Inflation Expectations – The ‘Reflation Trade’
Rate cuts may increase liquidity and stimulate economic activity, potentially raising inflation expectations. There are also some expectations in the market that re-shoring could lead to an inflation tick up just as off-shoring helped lower inflation in past decades.
3 - Supply and Demand Dynamics
The U.S. government may issue more long-term debt to finance deficits or new fiscal policies. Increasing the supply of Treasuries may push yields higher if there is reduced demand from foreign or large institutional investors.
4 - Shift in Risk Sentiment
When the Fed cuts rates, it may encourage investors to move away from "safe-haven" assets and into riskier assets such as equities. This reduced demand for Treasuries could push yields higher.
5 - Curve Steepening
Fed rate cuts typically lower short-term rates, but if investors believe the cuts are sufficient to avoid a deeper recession, the yield curve might steepen. This could cause the long end of the curve to rise as markets adjust for improved growth or inflation expectations.
6 - Global Factors
Rising global yields or changes in foreign central bank policies (e.g., the Bank of Japan allowing its yields to rise) can spill over into U.S. markets. Investors may demand higher yields on U.S. 10-year Treasuries to stay competitive.
7 - Fed Policy Credibility Concerns
A loss of confidence in the Fed’s ability to manage inflation – being ahead or behind the curve – could push yields higher in belief that the Fed is not actually in control.
8 - Higher Term Premium
While not directly observable, a higher term premium means investors demand more compensation to hold longer-term bonds as opposed to short-term risk-free debt.
During the most recent FOMC press conference, Chairman Powell said, “Longer rates have gone up – not because of expectations about our policy or inflation expectations – it is more of a term premium story…in this particular case it’s all happened at a time when, for reasons unrelated to our policy, longer rates have moved up.” Powell clearly believes they are in full control and that the reason rates have risen solely comes down to number 8 – investors demanding higher term premium. We lean toward it being a combination of factors 1, 2, 3, 7 & 8.
Government Deficits and Monetary Policy
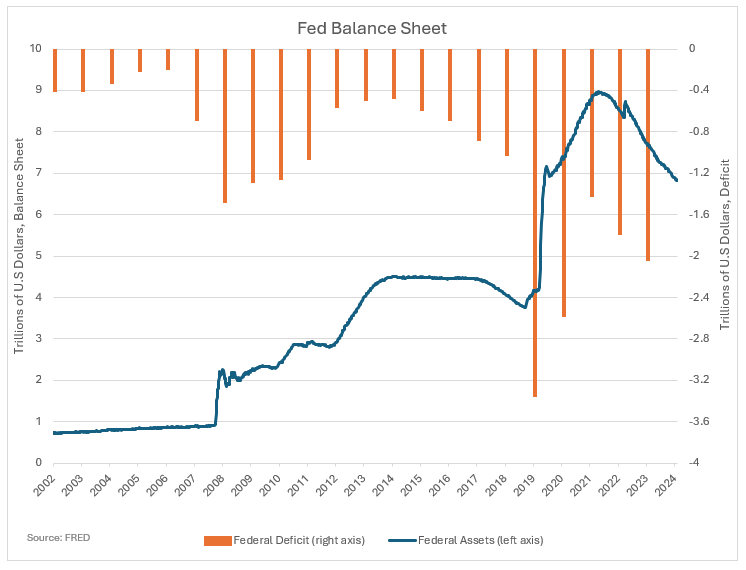
We believe fiscal policy is out of control and is not sustainable at these levels. This has led to massive borrowing needs by the U.S. Treasury. The chart below shows an accelerating pace of deficit spending since 2001. The average deficit over the past 5 years has been $2.23 trillion. This massive increase in debt has caused the interest cost to service this debt to rise significantly. Budgetary interest costs now exceed the amount we pay for national defense. Deficit spending by the government stimulated economic activity when the economy was going through Covid. However, even after Covid, the government continued to run big deficits during economic expansion. At the same time, the Fed continued raising the Fed funds rate to bring down inflation to acceptable levels. This created a supply imbalance of longer maturity US Treasuries.

During Covid, the Fed expanded its balance sheet to finance the deficits. This is called Quantitative Easing or QE. From 2020-5/2022 they bought about $5 trillion of UST debt. Since 5/2022 the Fed has been reducing their balance sheet from $9 trillion to a little under $7 trillion. This is called Quantitative Tightening or QT. This is shown in the chart below which shows the Fed’s Balance sheet compared to federal deficits. As you can see from the chart, the Fed is reducing its holdings of UST while the government is still borrowing massive amounts in the debt markets. We believe this helps to explain one reason why the interest rate on 10-year UST has risen while the Fed has been cutting short rates.
TFS Yield Curve Analysis and Portfolio Composition in The Muni Market
Yield curve analysis is a cornerstone of evaluating municipal bonds, offering insights into market conditions, interest rate expectations, and relative value. The Muni bond yield curve represents the relationship between the yield and maturity of tax-exempt securities from 1 to 30 years. Understanding its dynamics is essential for investors seeking to optimize portfolios while managing risk. We use our analysis of the curve and interest rate expectations to determine the optimal portfolio strategy for our investors. The chart below shows the shift in the Muni curve for AAA-rated Munis from 09/17/2024 to 1/29/2025.
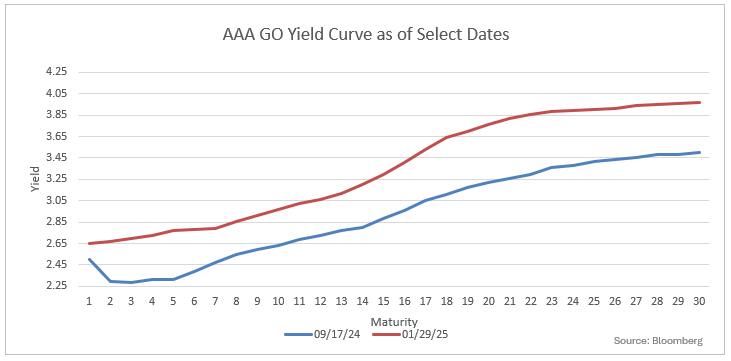
Beginning in March 2022, the Fed finally realized inflation was out of control and initiated a policy change to tightening by raising the Fed Funds target. This continued until July of 2024. Their shift to a focus on inflation caused the yield curve to invert as shown above. We believe these conditions were ideal to structure our portfolios using a barbell strategy. By employing a barbell, we have been able to lock up higher rates for longer by extending maturities out to the 20-year range. We manage the duration risk of the portfolio with shorter maturities. We employ diligent security selection combined with this strategy to improve the overall yield of our portfolios.
A barbell strategy in municipal bond investing involves holding a combination of short-term and long-term bonds, with little to no intermediate maturity bonds. This strategy can provide several advantages for municipal bond portfolios, particularly in a volatile or rising interest rate environment.
1 - Interest Rate Sensitivity Management
The short-term bonds in a barbell strategy have lower duration and are less sensitive to interest rate changes, which means their prices won’t decline as sharply when rates rise. Meanwhile, the long-term bonds offer higher yields due to their extended duration, but they are more vulnerable to rate hikes. By balancing these two segments, investors can mitigate some of the interest rate risk while still capturing higher yields in the long-term portion of the portfolio.
2 - Flexibility and Liquidity
Short-term bonds typically mature in a few years, providing the opportunity for reinvestment at prevailing interest rates. This allows the portfolio to adjust more quickly to changing market conditions. In a rising interest rate environment, short-term bonds can be rolled over into higher-yielding bonds as they mature, providing a consistent income stream.
3 - Enhanced Yield Potential
Long-term municipal bonds often offer significantly higher yields than their short-term counterparts to compensate for the added risk of a longer maturity. This creates a yield advantage for investors who are willing to take on the potential price volatility of long-term bonds. The barbell strategy allows investors to capture these higher yields while still maintaining liquidity with the short-term bonds.
4 - Diversification
The barbell approach creates a diversified exposure to different maturities, reducing the portfolio’s overall risk. With bonds in both short and long durations, the strategy benefits from both stability and yield, allowing investors to balance risk and return effectively in uncertain market environments.
Overall, we believe the barbell strategy is a wise way to navigate interest rate risk while seeking to optimize returns in municipal bond portfolios.
Conclusion
Stocks are in year 3 of a bull market and there are many factors in the economy that remain strong. GDP remains fairly robust, the jobs market remains strong and unemployment has inched back down. We continue to watch inflation as it has almost been moving sideways now for the past year – Core PCE was 3% in December of 2023 and was 2.8% in December 2024. With 25% and 10% tariffs being proposed on multiple countries, there are potential inflationary pressures on the horizon. The wild card remains the Fed. Powell and Trump may not see eye to eye but they both want lower rates. We believe we will continue to trade in the 4.25-5% range on the 10-Year Treasury in the near term unless we begin to see weakness in the economy.