2024 Q2 Review
Closing out 2023, financial markets were pricing in 6 rate cuts from the Federal Reserve after Powell’s ‘Pivot Party’ in December. Economic data in the first half of the year has caused the Fed to be less sanguine and changed the outlook for the economy. Higher-for-longer sunk in and the bond market responded.
Yields have risen again for Treasuries and Municipal Bonds in the first half of 2024. While the Muni curve (below) is still inverted, we have seen bear steepening as the yields in the belly of the curve have risen substantially more than longer-dated Munis. Yields 14-30 years out have risen 23-30 basis points, while yields 3-6 years out (part of the belly) have risen 62-66 basis points thus far in 2024.

Source: MMD
Inflation & The Federal Reserve
Economic data in Q2 has sent mixed signals. With an inflation target of 2%, we believe it is still too early to declare victory. According to the Bureau of Economic Analysis, Core PCE sits at 2.57% YoY (below). However, the 6-month annualized Core PCE is still 3.18%. Core CPI, like Core PCE, strips out food and energy while Supercore PCE strips out energy and housing. Both readings sit even higher than Core PCE near 3.4%.
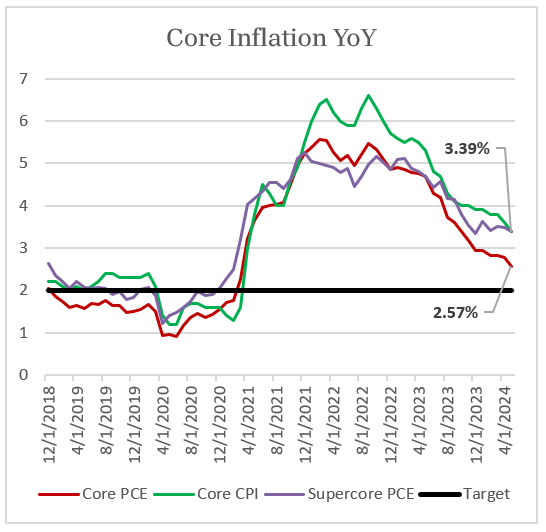
Source: BEA
Federal Open Mark Committee members have responded to the data and shifted projections. In December, 11 of the FOMC members believed there would be 3 or more cuts in 2024 (below). Today, 0 members believe there will be 3 or more cuts – all 19 members project there will be 2 or less cuts in the Federal Funds Rate this year.
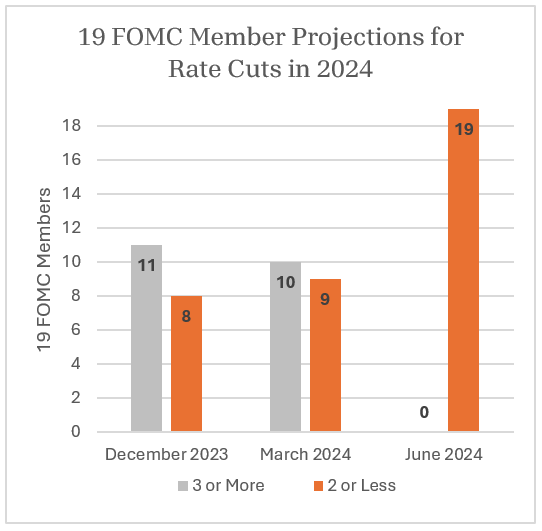
Source: FOMC
The Consumer: Falling Behind
For much of 2023 we continued to hear that the economy is robust, and the consumer is remaining resilient. Those narratives have quieted. The upper bound Federal Funds Rate has now remained at 5.5% for 48 weeks – almost one full year. The current hiking cycle began on 3/16/2022 – 119 weeks, or 2 years, 15 weeks and counting. This acts like a slow restriction on the consumer that compares to higher altitude in the mountains on the lungs. At first it is not an issue but, as time goes on, the effects are felt and unintended consequences can occur.
The chart below looks at the past 5 years. The median salary has increased by 26% according to the Bureau of Labor Statistics. That is great for the consumer but not in comparison to how much prices have risen in other areas. Student loan debt has increased by 44%. According to Moody’s, the monthly payment on a new car has increased 42% from 5 years ago. While not shown below, average premiums for full coverage auto insurance have risen 26% in the past year alone according to Bankrate. The consumer is falling behind – especially when it comes to housing.
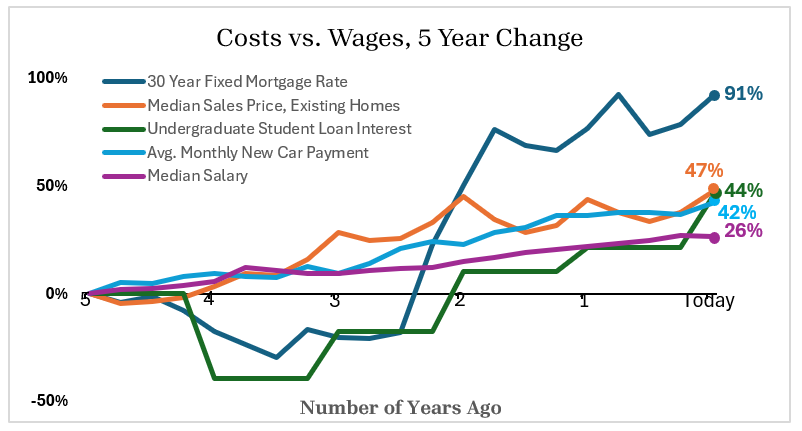
Sources: Moody’s, Bankrate, BLS, US Census Bureau
Consumer: Unaffordable Housing
The chart below illustrates how housing has become extremely expensive for the average household. After hitting an all-time low of 93.6 in September, the U.S. Housing Affordability Index sits at 103. According to the National Association of Realtors (NAR), “When the index measures 100, a family earning the median income has exactly the amount needed to purchase a median-price resale home using conventional financing.”
However, with existing home prices up 47% over 5 years and 30-Year mortgage rates up 91% over the same span, we wonder if this chart overestimates how affordable homes are to the average consumer. Other data from NAR - U.S. existing home sales – validates this concern as home sales have lagged significantly since the home buying frenzy of mid-2021.
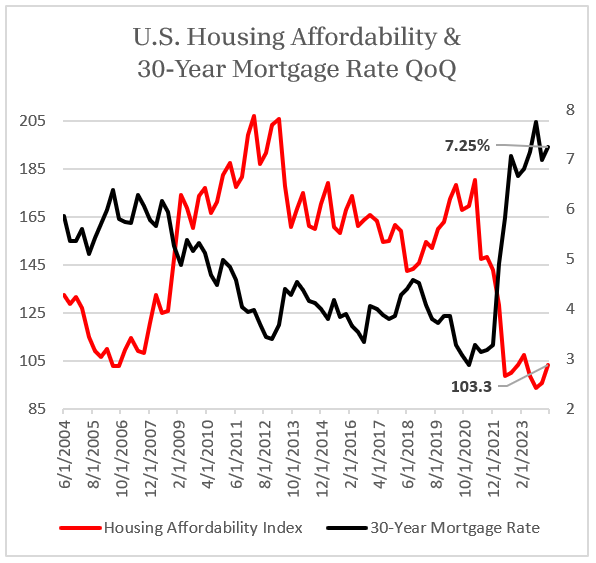
Source: NAR
The Consumer: Personal Saving & Personal Debt
Over $8 Trillion of Fiscal stimulus flooded into the economy since March 2020. Much of the money is still sloshing around the economy. The final $6 Billion was just handed out from the Chips & Science Act.
The pandemic and the $8 Trillion will mark this generation – some rent payments and loans paused, demand shifted, consumer behavior changed, and inflation rose. The top 50% of the U.S. grew in wealth and have over $6 Trillion in money markets. The bottom 50% are fighting to get by.
On the right is one illustration of this from the Bureau of Economic Analysis. The average personal savings rate since 1960 is 8.5%. The average is 5.8% since 1995. But since 2022 – even after all the monetary and fiscal stimulus – the average savings rate is 3.9%. Even more, this is during a time when student loan payments have been paused. Credit card and auto loan delinquencies are on the rise but the economy has hung on because unemployment has stayed at historically low levels.
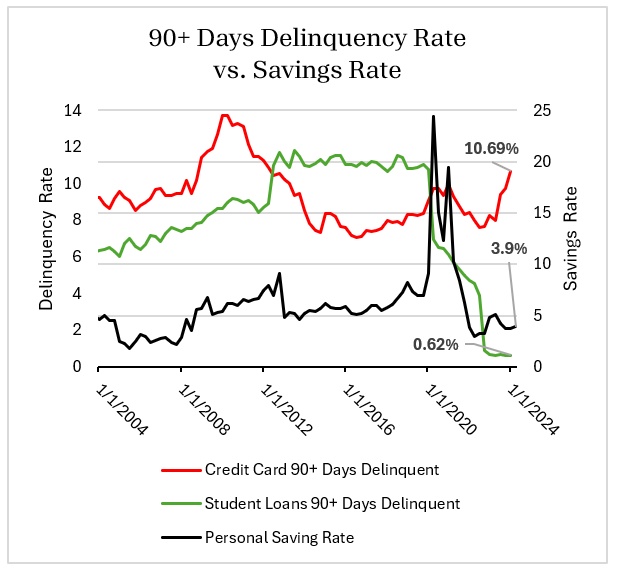
Sources: NY Fed, BEA
The Consumer: Unemployment
If we can avoid a recession, it will be in part to the labor force normalizing on its own and unemployment remaining at these low levels. Below you can see unemployment rose by 10%, 13%, and 14% before the recessions in 1990, 2001, and 2007 respectively. Unemployment has risen 18% since April 2023 but we started at a lower base (3.4%) than ever before. The economy has been at or below 4% for 30 months – the longest stretch since Vietnam in the 1960’s. We continue to monitor the upward trend.
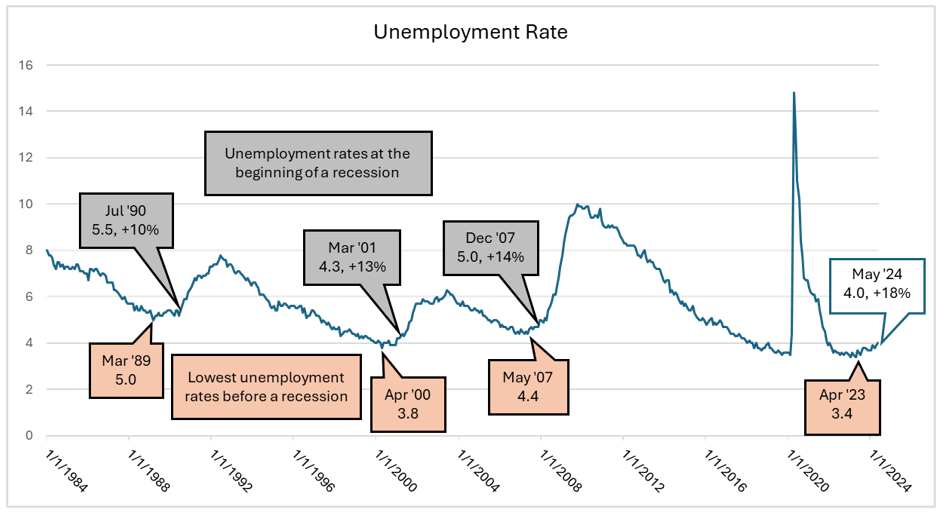
Source: BLS
Municipal Bonds: Remote Work Shifts
Just as there have been shifts for consumers, there have also been many shifts for municipalities over the past 5 years. The massive fiscal response was a boon to states and cities to help navigate the COVID environment. Over time, we will find out which cities and states have been more fiscally responsible.
As a result of COVID and the shutdowns, work from home or partial remote work has now become more of a norm for many companies. As seen below, the U.S. office vacancy rate has jumped from 13.2% to almost 20% as the share of days worked from home have gone from 5% to almost 30% in a 4-year span. There are trickle-down effects to cities balance sheets from this as they collect less tax revenues from rent, decreased public transit ridership, decreased parking revenue, etc. This has large impacts on cities such as New York, Chicago, and Los Angeles.
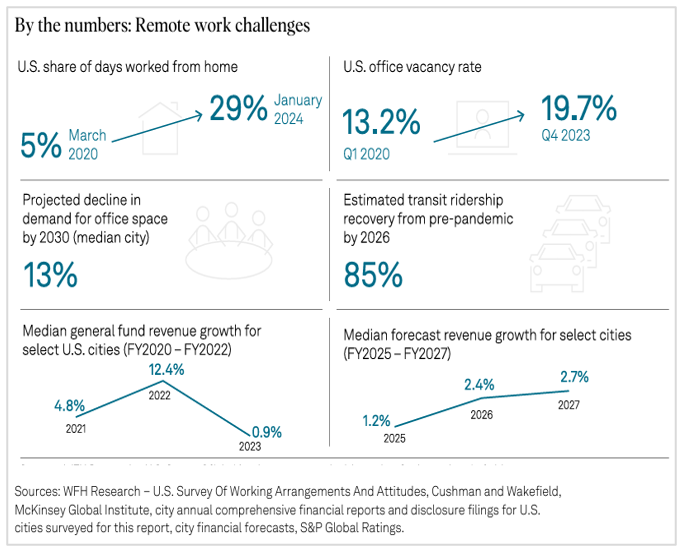
Source: S & P
Municipal Bonds: State Ratings
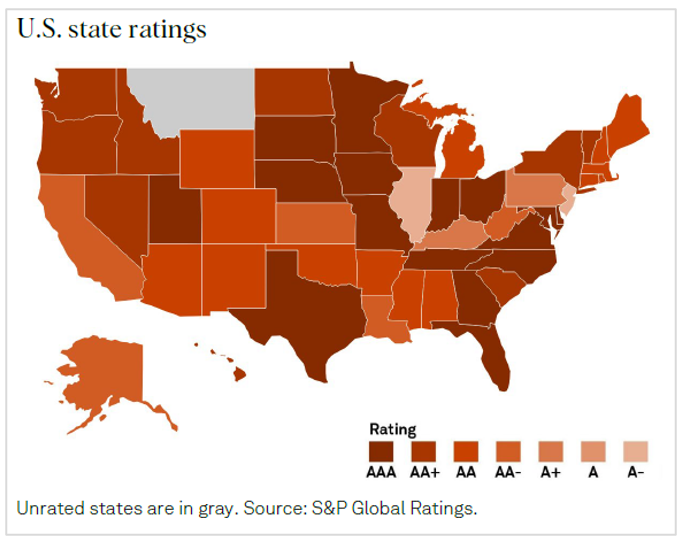
Ratings represented in the map below are for the state general obligation debt. 26 states have budget reserves above 15% as of May 31st. The 4 lowest rated states – Illinois, New Jersey, Pennsylvania, and Kentucky – are all above an A- rating but they are states that we avoid when we can. Overall, there are 6 states with positive outlooks and Mississippi is the lone state currently with a negative outlook on its rating.
In general, we feel good about individual state balance sheets and reserves but there have been recent headlines concerning certain municipalities that have caught our attention. New York has put $16 Billion in MTA projects on hold, Buffalo is under scrutiny for raising taxes and dipping into reserves, and multiple large CA and TX cities are facing revenue shortfalls. This is something we continue to monitor and why we typically avoid larger cities with high unfunded pension liabilities.
Bottom-Up Analysis: Security Selection – Charter Schools
Beginning about 30 years ago, charter schools emerged as an alternative to district schools. The state of Arizona has embraced charter schools and has passed some of the most progressive charter school legislation in the country. These schools operate as autonomous public schools and receive some state funds. Charter schools typically receive funding on a per pupil basis. This funding is usually less than district funding, because it does not include monies for capital improvements and maintenance of facilities. They are also accountable for student achievement, and do not charge tuition.
Opportunities For Muni Bond Investors
The growth in charter schools has led to an increase in the number of tax-free financings to build facilities for these schools. The market for charter school bonds is an inefficient market that offers higher yields and opportunities for knowledgeable investors. In general, this sector is perceived as riskier because past schools have been run improperly or mismanaged. Most schools which have not done well are smaller schools with well-meaning but inexperienced management, leading to poor results. However, we know many charter school groups that have been producing excellent results in their students and have a sophisticated and experienced management team. These are the types of schools we want to help finance.
Important Things to Look For
We believe the key variables for successful investing in charter school bonds are the following:
A network of existing schools. This is very important. After the first Charter School is opened, if it is successful, there will be demand for more students to attend the school and a waiting list will be created. When enough students are on the waiting list a new school is opened. As the Charter group grows, the record of academic performance becomes more meaningful, and a financial history is created. We prefer to see a network of 7 or more schools with the original charter being in existence for at least 8 years.
Historical record of academic success. Charter Schools are required to be accountable for student academic achievement. This is done primarily through testing such as AIMS and PSAT/NMSQT. Schools whose students don’t score well on these tests are in danger of not having their charters renewed. To mitigate this risk, investors should only look at schools that have a record of strong academic achievement. The State of Arizona gives each school a ‘report card’ and we only consider schools that are rated A or B.
Strong management and governance with a proven track record. The Charter groups that have already opened several schools on time and without cost overruns while meeting budget estimates are the most desirable. We look for groups which have strong boards and experienced administrators with good track records of successfully operating within budget.
Waiting list of applicants for admission. Successful Charters create strong demand for their schools. One measure of this demand is waiting lists for admission. The best schools have waiting lists that are large enough for them to open another school to meet the demand. We also prefer to see positive enrollment trends.
First lien and security interest in facility being financed. We like to help finance schools that have purchased suitable property ‘on the cheap’ and give investors a first claim on the property. Revenues for the school flow from the state to the Bond Trustee through a direct intercept mechanism to protect bondholders.
Record of financial soundness for each school in their network. Investors should look for charters where each school is financially sound. This demonstrates good governance and management by the Charter group.
Source: S & P
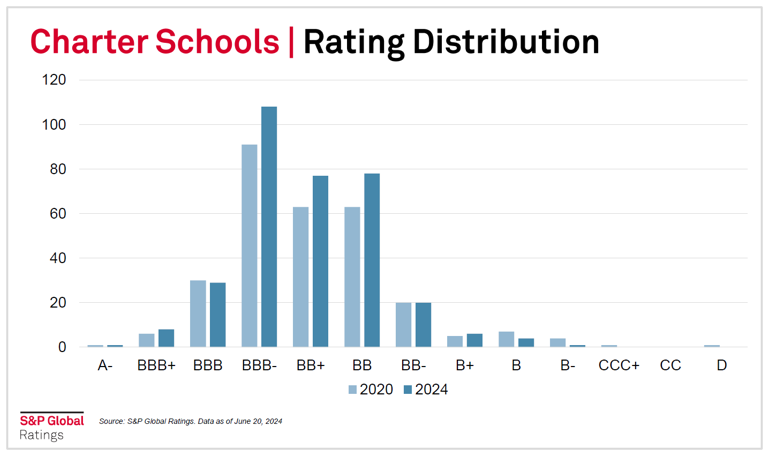
Ratings
The chart above is from a recent report showing the rating distribution for charter schools. The chart depicts general improvement in credit quality since 2020. The largest category is for bonds rated BBB-. Research shows that most credit concerns are in bonds rated BB- or lower.

TFS Rating Distribution
We find value in this sector for bonds that are rated investment grade or higher. In fact, over 90% of our holdings fall into this category. The chart above shows the breakdown by percentages for our Arizona charter school holdings. A little more than 35% of our bonds are rated AA- due to the Arizona charter school enhancement program and we have no exposure to bonds rated BB- or lower. By employing careful security section, this has been a great sector where we add additional income and yield to our portfolios without increasing credit risk significantly.
Munis > Treasuries and Cash
There is currently over $6 Trillion in money market funds in the United States. Making 5% in cash has not been possible since before the Great Financial Crisis so it is obviously attractive for many investors. In this environment, investors are also drawn to Treasuries. While Treasuries are more attractive than they have been in over a decade, we believe Municipal Bonds are a superior asset for high-net-worth clients. If a client is in a high tax state like CA or NY and in the 37% Federal tax bracket, Tax-Equivalent yields can surpass 8%.
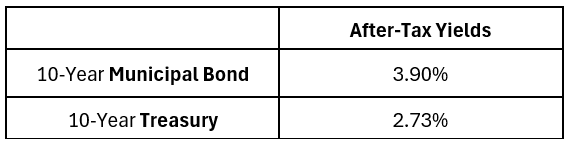
For this example, when comparing Munis vs Treasuries, we will look 10 years out. A 10-Year Treasury maturing in 2034 yields 4.34%. As with any investment, it is not what you make but what you keep. If you pay federal taxes of 37%, your 4.34% yield turns to 2.73% after-tax. In Q2 we have been buying Munis around 2034 at yields of 3.90%. In our opinion, if you are in a higher tax bracket, yields in Munis far surpass Treasuries on an after-tax basis. Now is the time to consider putting more of your cash to work in Munis.
Conclusion
The FOMC continues to watch the economic data come in and so do we. There are factors that could make yields fall: higher unemployment, an increase in defaults, or an economic slowdown. There are also factors that could make yields rise: persistent inflation from re-shoring or higher tariffs, liquidity problems, or deficit funding issues. The consumer makes up about 70% of GDP and seems to be increasingly leveraged. Our federal government deficit also continues to grow.
We are hoping for immaculate disinflation, a soft landing, for this time to be different - and other positive market narratives to come to fruition. However, in the end, we believe it could be a choppier 2nd half of the year – in politics and in the markets.